Tell me your idea. I'll build the first draft of your map.
Don't overthink it — write like you'd explain it to a smart friend. Then hit analyze, and the whole worksheet fills in for you to review and sharpen. Prefer to fill it in yourself?
Cover as much of the list below as you can — industry, problem, who feels it, how often.
So we can save your map and email your report when you're done.
Returning? Load your saved maps Switch maps, start a new one, or sync from another device
On another device? Load every map saved to your email.
Before you map anyone, name the ground.
A competitive map only means something once the problem is real and the person feeling it is specific. This is the setup the rest of the analysis stands on.
Most problems are felt by more than one kind of person. List the segments who live this problem, mark how acutely and how often each feels it, and flag your primary and secondary targets. Uncheck any that don't fit, edit the wording, or add your own.
Who's already on this ground — and how good are they?
List the real alternatives, including workarounds and "do nothing." Rate each on solution quality and moat — how good they are, and how defended that strength is. Source links are optional.
One number for the whole market — sets the vertical axis on your 2×2. Every player in this space shares it.
The 2×2 shows position. These four layers show movement — the stuff that tells you where the terrain is heading. Notes only; keep it fast.
This table builds itself from your competitors above. Open each competitor's comparison detail to fill segment, differentiation, distribution, and moat — it appears here live, and becomes page 2 of your downloadable map.
Where do you land?
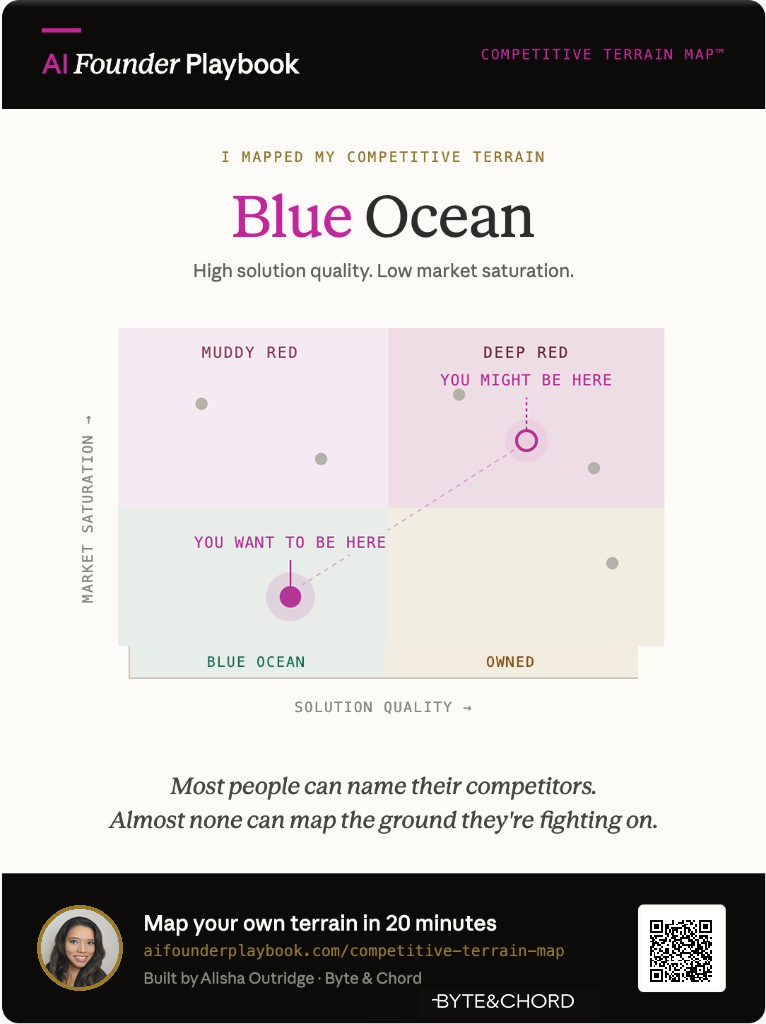
Your competitors are already on the map. Now place yourself — rate your solution quality and how defended your moat is. Your terrain type reads from where you sit against the field.
Each dot shows its moat: a solid ring means fortified, a dashed hollow means exposed — and exposed is takeable, even when the product is strong.
Even a crowded ocean has an opening.
Whitespace is the gap only you are positioned to take. Pick the one that best describes your opening, then write the move in one line.
Nice work. View your competitive terrain map
Every input from your session, in one report.
Tap any dot in the map above to see what it is — and what it means.
90 minutes with Alisha Outridge. Small rooms, real deliverables.90 minutes with Alisha Outridge.

You mapped the red ocean. Now break out of it.
Method adapted & updated by Alisha Outridge from Blue Ocean Strategy, W. Chan Kim & Renée Mauborgne.
Each line is a player's value curve across the factors this industry competes on. A blue ocean shows up as a curve that diverges from the pack — high where others are low, absent where others pile in.
To create a new value curve: Eliminate and Reduce what the industry over-invests in; Raise and Create what it ignores. This is how you break the value-cost tradeoff.
We're finishing the AI-powered Strategy Canvas. Get first access when it launches.
 — brought to you by
  .
.